
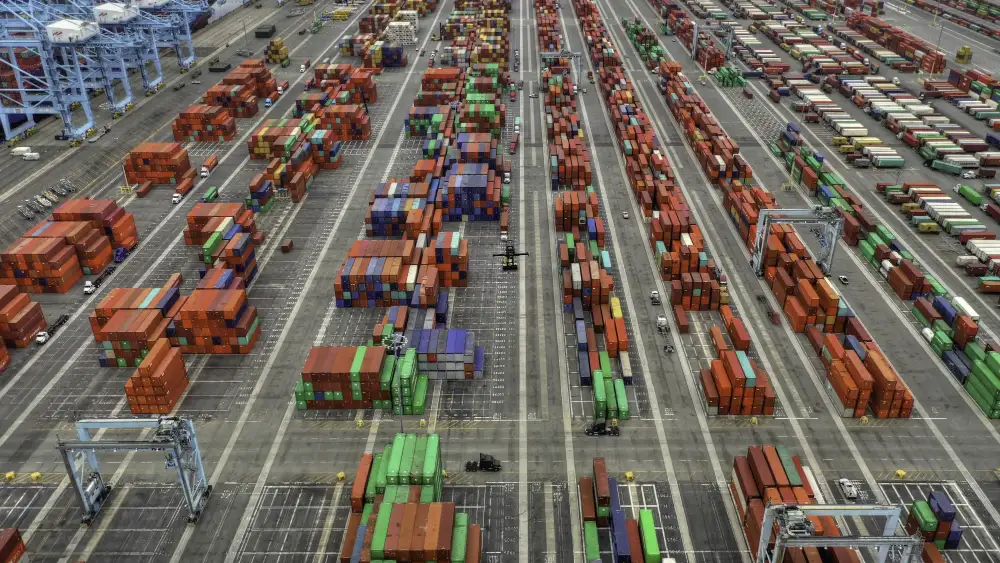
India's Grade A industrial and warehousing supply is on track to reach 45–50 million sq ft by the end of 2026, against roughly 22 million sq ft leased across the top eight cities in the first half of the year. Supply is growing faster than demand nationally — completions rose 27% year on year while leasing rose 12% — and that divergence is the single most useful thing a buyer can understand about this market right now.
The national picture in five numbers
| Measure | H1 2026 | Change |
|---|---|---|
| Total leasing | ~22 mn sq ft | +12% year on year |
| New completions | ~25 mn sq ft | +27% year on year |
| Vacancy rate | 17.2% | Rising, as supply outpaces demand |
| Q2 leasing | ~11 mn sq ft | −1% against Q1 |
| Full-year Grade A supply forecast | 45–50 mn sq ft | — |
Completions outpacing leasing by 3 million sq ft in a single half explains the 17.2% vacancy. It also explains why the national average is a poor guide to any particular city — and why the Bengaluru numbers below look so different.
Demand is concentrating, not spreading
Two markets took the bulk of the activity:
- Delhi NCR and Chennai together accounted for more than 45% of total demand.
- Delhi NCR and Mumbai together took more than 40% of all new supply.
For a manufacturer or investor looking at Karnataka, that concentration is the opportunity rather than the warning. National supply is being absorbed by two or three metros; the corridors that serve South Indian manufacturing are competing for a smaller share of new completions, which is why local vacancy diverges so sharply from the national figure.
Bengaluru is running against the national trend
| Measure | India | Bengaluru |
|---|---|---|
| Leasing growth | +12% | +78% |
| Vacancy | 17.2% and rising | 11% and falling (from 13%) |
| Warehouse leasing volume | ~22 mn sq ft | 3.1 mn sq ft |
Bengaluru posted the fastest warehouse leasing growth of any major Indian market in H1 2026. Nationally, vacancy rose because builders delivered more than occupiers took. In Bengaluru, roughly 2 million sq ft of new Grade A supply met 3.1 million sq ft of leasing, and vacancy fell. Two markets, opposite directions, same six months.
Which sectors are driving it
The occupier mix differs between the national picture and Bengaluru, and the difference matters when you are choosing a parcel.
| Occupier type | India | Bengaluru |
|---|---|---|
| Third-party logistics | 30% | 58% |
| Engineering | 21% | — |
| E-commerce | 16% | 15% |
| Manufacturing | — | 16% |
| FMCG | — | 8% |
| Electronics | Nearly doubled year on year | — |
Two things stand out. Bengaluru's 3PL share is nearly double the national figure, which tells you the city is being used as a distribution hub as much as a manufacturing base. And electronics roughly doubled nationally — relevant in Karnataka, where Vemagal already hosts Tata Electronics and Kotoor-Belur carries a 224.5-acre MeitY-backed Electronics Manufacturing Cluster.
What a buyer should take from this
Do not price a Karnataka parcel off a national vacancy figure
17.2% nationally and 11% in Bengaluru describe genuinely different conditions. A seller quoting national softness on a tight local corridor is not describing your market.
Match the corridor to your occupier type, not to the average
If you are a manufacturer, you are competing against a leasing market that is 58% logistics in Bengaluru. Parcels specified for 3PL may not carry the power and effluent capacity a process unit needs.
Watch land, not rent
Bengaluru land prices rose 9–10% in H1 2026 against 4–5% rental growth. Where land outpaces rent, the market is pricing future scarcity.
Electronics is the sector to watch in Karnataka
Near-doubling of electronics leasing nationally, combined with the state's existing ESDM clusters and central EMC 2.0 assistance, points to where the next competition for parcels arrives.
Frequently asked questions
Is India's warehousing market oversupplied in 2026?
Which Indian cities are absorbing the most industrial space?
How much Grade A industrial supply will India add in 2026?
Does national oversupply mean industrial land in Karnataka will get cheaper?
What is Grade A industrial space?
Sources
National figures: Colliers India H1 2026 research. Bengaluru figures: Cushman & Wakefield H1 2026 Logistics & Industrial MarketBeat. Karnataka corridor detail from our own area records.
Working out whether the national picture or the Karnataka picture applies to your requirement? Send us the brief and we will tell you which corridors actually have capacity.



 Home